
08 September 2025 : Nifty 50 Technical Analysis: Head & Shoulders Pattern, RSI, MACD Signals, and Navratri Seasonal Trends
Chart Pattern Analysis
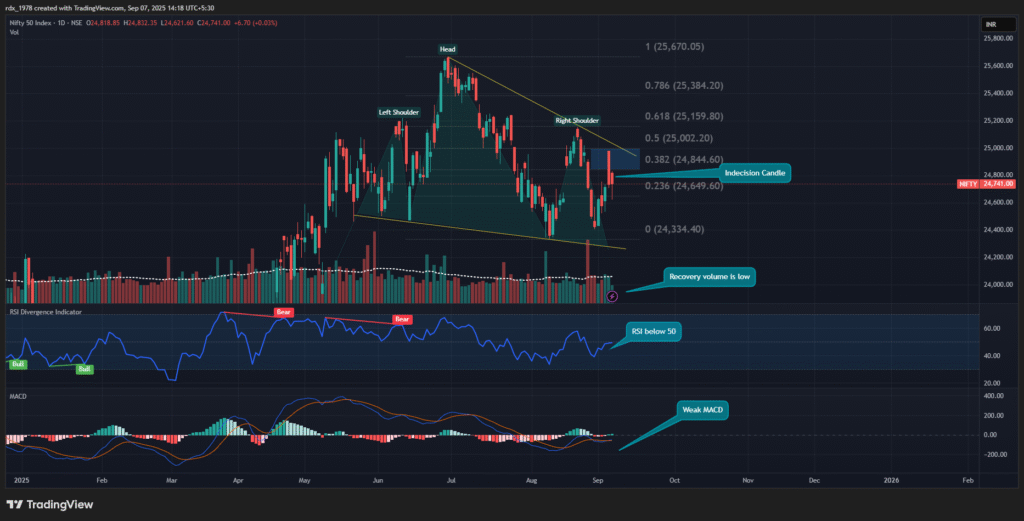
The dominant structure on the chart is an incomplete Head and Shoulders pattern, with clearly labeled “Left Shoulder,” “Head,” and “Right Shoulder.” The neckline is downward-sloping, with price recently testing this boundary but failing to decisively break above it, indicating unresolved direction and a potential for a significant move upon resolution.
Fibonacci retracement levels from the swing low near 24,334 to the swing high at 25,670 are plotted, and price is currently hovering around the 23.6% (24,649) and 38.2% (24,844) retracement levels, suggesting these are critical support-resistance zones for short-term direction.
Volume Analysis
The chart annotation highlights that recovery volume is low, meaning recent upward price moves are not supported by strong buying activity. This lack of volume confirmation raises caution about the durability of any bullish reversal attempts and suggests sellers are not facing strong resistance from bulls.
RSI (Relative Strength Index)
The RSI is below 50 and annotated as “Bear,” firmly in the neutral-to-bearish momentum zone. Previous incidences of RSI bearish divergence are marked and coincide with tops, while the current RSI suggests neither strong oversold nor overbought conditions, but rather an absence of short-term bullish strength.
MACD (Moving Average Convergence Divergence)
The MACD is described as “Weak MACD,” indicating minimal momentum in favour of either bulls or bears. MACD lines are close together, and histogram bars are muted, reinforcing the view that the trend lacks conviction.
Candlestick Patterns
The last two candles show a pattern resembling Bearish Engulfing—a red candle engulfing a smaller green one. Additionally, for September 5th, the market formed a spinning top/indecision candle with a small real body and a long lower wick, signalling market indecisiveness and a potential inflexion point.
Support and Resistance
- Strong support sits just above 24,334 (the recent swing low).
- Key resistance is near 24,844 (38.2% Fibonacci level), then 25,000–25,200 zone (50% and 61.8% retracement).
Trend and Outlook
- The prevailing trend is sideways-to-weak bearish, with the Head and Shoulders pattern yet to confirm a breakdown or reversal.
- Indicators (low volume, weak MACD, RSI <50) and indecision candle suggest caution—market is searching for direction and could see increased volatility if support or resistance is broken decisively.
- Historical seasonality favours larger moves post-Navratri, so traders should remain alert for a breakout from this consolidation in the coming weeks.
Summary Table
| Factor | Signal | Bias |
|---|---|---|
| Price Pattern | Head & Shoulders | Bearish/Neutral |
| Volume | Low | Bearish |
| RSI | Below 50, Divergences | Bearish |
| MACD | Weak/Flat | Neutral |
| Recent Candles | Bearish Engulfing, Indecision | Mixed |
| Support Zones | 24,649 – 24,334 | Important |
| Resistance | 24,844 – 25,159 | Critical |
In conclusion, Nifty is at a pivotal point: the technicals currently favour caution and range-bound action with a possible bearish tilt unless there is a decisive breakout, but the seasonal tendency for strong moves after Navratri should also be considered for the upcoming trade strategy.