Nifty 50 Technical Analysis: Key Levels, Head & Shoulders Pattern, and Bearish Signals for September 2025
Nifty 50 Index Technical Analysis for September 1, 2025: Key Levels & Advanced Chart Insights
The Nifty 50 Index delivered a technically charged session as August came to a close, setting the groundwork for a pivotal start to September. In this blog, we perform an advanced, professional breakdown of market structure, utilising moving averages, candlestick patterns, volume action, and leading momentum indicators to present actionable insights for traders and investors.
Market Structure: Head and Shoulders, Fibonacci Levels
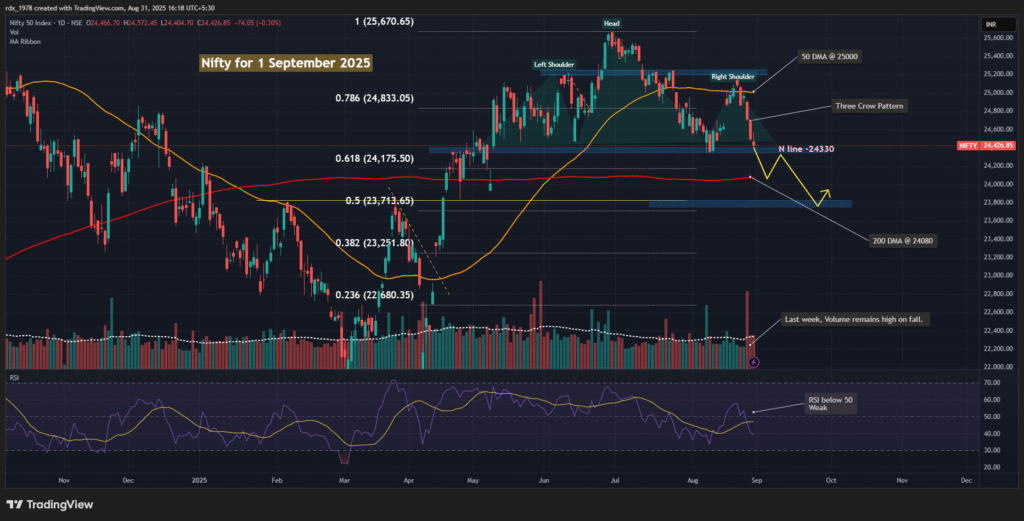
The daily chart of the Nifty 50 reveals a prominent Head and Shoulders reversal pattern, a classic technical signal hinting at a trend transition from bullish to bearish. The neckline support region, plotted around 24,330 INR, aligns with a critical Fibonacci retracement level (0.5 at 23,713.65, 0.618 at 24,175.50), amplifying the importance of this zone.
Above, resistance is defined by the 50-day moving average (DMA) at 25,000, while further support appears near the 200 DMA at 24,080, which also coincides with the next Fibonacci retracement.
Table: Key Nifty 50 Technical Levels
| Level | Price (INR) | Relevance |
|---|---|---|
| Recent High | 25,670.65 | Head of H&S, major swing top |
| 50 DMA | 25,000 | Short-term trend resistance |
| Neckline Support | 24,330 | Key trigger level |
| 200 DMA | 24,080 | Long-term trend support |
| Fib 0.618 | 24,175.50 | Strong retracement support |
| Fib 0.5 | 23,713.65 | Intermediary retracement |
Bearish Signals: Three Black Crows & Volume Confirmation
Notably, the chart exhibits a rare Three Black Crows pattern immediately following the right shoulder of the Head and Shoulders formation. This bearish candlestick trio suggests persistent selling pressure and a possible continuation to the downside.
Supporting this thesis, volume analysis indicates “Last week, volume remains high on fall,” portraying distribution activity as institutional participants exit positions at key levels.
Moving Averages: The Dynamic Support/Resistance
The 50 DMA (25,000) has begun flattening and curving lower, warning of a near-term momentum loss. The 200 DMA (24,080) below provides the next significant area to watch, serving as both psychological and structural support for market participants.
Momentum Analysis: RSI Weakness
The Relative Strength Index (RSI) sits below the 50 mark, signalling weakening bullish momentum and a tilt toward bearish control. An RSI reading below 50 typically measures the market’s failure to sustain rallies, reinforcing bearish conviction for the coming days.
Price Projection & Scenario Analysis
The yellow projected path on the chart illustrates two possible movements:
- A break below the neckline (24,330 INR) could trigger a fall toward the 200 DMA at 24,080, which aligns with major Fibonacci support zones.
- Should the index find support at these levels, expect a rebound attempt; however, any sustained move below 24,080 could accelerate the downside toward the next retracement at 23,713.65.
Bearish Case (Primary Scenario – H&S Breakdown)
- Head & Shoulders Measured Target
- Head peak ≈ 25,670
- Neckline ≈ 24,330
- Height = ~1,340 points
- Breakdown target = 24,330 – 1,340 ≈ 22,990 (~23,000)
This aligns well with Fibonacci 0.382 support 23,250–23,300 and psychological round level 23,000.
- Volume confirmation: High volumes on fall → sellers are aggressive.
- RSI trending down below 50 → momentum supports further downside.
Bearish Path:
24,330 neckline → 24,080 (200 DMA) → 23,700 → 23,000 ultimate H&S target.
Bullish Case (Alternate Scenario – False Breakdown)
- If NIFTY reclaims 24,500–24,600 zone quickly and sustains, the H&S breakdown could be a bear trap.
- In that case:
- Short covering + momentum could take it back toward 24,833 (Fib 0.786) and even 25,000 (50 DMA).
- RSI bouncing above 50 would be the first signal of strength.
Bullish Path:
Reclaim above 24,500 → rally to 24,833 → retest 25,000 (50 DMA).
Summary: What to Watch for Nifty Traders
- Neckline at 24,330 INR: The critical battle between bulls and bears.
- 50 DMA & 200 DMA interaction: Confluence zones for trend direction.
- Volume spikes on falls: Continual high volume on declines signals possible distribution.
- Bearish candlestick clusters: Three Black Crows and Head & Shoulders reinforce downside risk.
Pro Tip for Traders
Monitor intraday price action and volume at the highlighted support levels. If Nifty closes below the 200 DMA on above-average volume, the bias strongly favours further downside. Conversely, a successful defence and bounce above 24,330 could bring a relief rally, but confirmation is key.
Conclusion:
The Nifty 50 faces a technically charged bear scenario as September begins. By layering multiple advanced technical tools—chart patterns, moving averages, Fibonacci zones, candlestick analysis, and volume—we gain a clear strategic edge. Stay vigilant for breakout or breakdown confirmation at the outlined price levels to optimise trade setups.