
20 October 2025 : Nifty Weekly Outlook: Technical Analysis and Gap-Up Strategy for 21-25 October 2025
The Nifty 50 index has entered a strong breakout phase, supported by robust volume and bullish sentiment, as it pushes into uncharted territory for the week of October 21–25, 2025. Despite tempting setups, traders should exercise extreme caution when considering short-selling the index at current levels. In trending markets, especially after a decisive gap-up and breakout, short positions carry the risk of swift short squeezes and potentially unlimited losses, as the index could continue its upward momentum with little resistance overhead. Always manage risk prudently and avoid aggressive shorting against the prevailing trend, as chasing tops can result in steep losses and margin pressure.
Chart Analysis Highlights
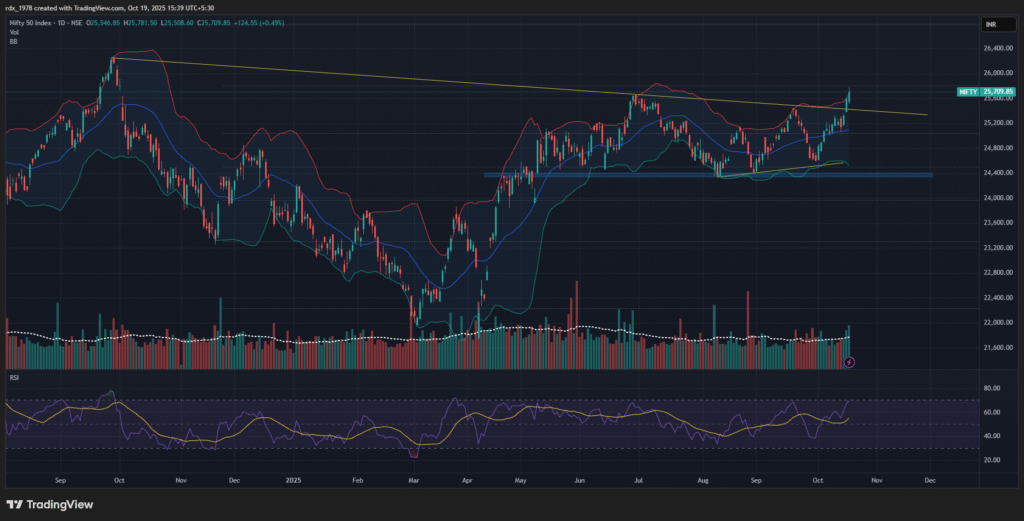
- Breakout Confirmation: The chart shows Nifty breaking above a long-standing descending trendline (yellow line), supported by a surge in volume and a recent strong close near 25,710, which generally indicates bullish momentum.
- Bollinger Bands: The Nifty is trading at or above the upper Bollinger Band, suggesting the index may be overbought or entering an expansion phase. This often leads to either continued runaway rallies or short-term exhaustion.
- Support/Resistance Levels: The zone around 25,400–25,500 (previous resistance) will now act as key intraday support on any reversal. There’s limited historical resistance overhead, signalling the possibility of a trending move.
- RSI: The RSI is in bullish territory but is approaching overbought levels, indicating strong momentum and a risk of quick pullbacks.
Scenario: 150–200 Point Gap Up
If Nifty opens 150–200 points higher (~25,850–25,900), the index will likely be well above recent resistance and pushing into uncharted territory.
Suggested Moves for the Week
- For Longs (Bullish Bias):
- Consider holding or adding to long positions on any intraday dips, especially if the index sustains above 25,700. Price action above this level confirms strength and breakout validity.
- Use trailing stop-losses to lock in profits as the move is extended and volatility could spike.
- For Cautious Players or Short-Term Traders:
- If the post-gap price action shows exhaustion (e.g., shooting star candle, high wicks, stalled momentum), partial profit booking is prudent.
- Watch for bearish reversal patterns intraday—selling pressure above 25,900–26,000 could trigger a short-lived pullback.
- Options Traders:
- IV is likely elevated from the gap up. Consider strategies like selling OTM call spreads above 26,200, or short-term iron condors if volatility remains extreme.
- Avoid aggressive shorting unless there is a clear intraday reversal signal, as breakouts from such patterns can be persistent.
- Gap-Fill Probability:
- If the gap holds in the first hour of trade and participation remains strong, a trending move towards 25,950–26,000 is possible.
- Failure to sustain above 25,700 may signal a “failed breakout” and could trigger a retracement down to 25,400 levels.
Open Interest (OI) and Max Pain Analysis
- Open Interest (Call vs Put):
The OI is highest in the 25,500 and 25,600 strike CALLs, with significant build-up also present at 25,700 and 25,800. On the PUT side, the largest OI clusters are at 25,500 and 25,400, followed by sizeable positions at 25,600 and 25,700. - Identifying Max Pain:
Max pain is typically the strike where the combined PUT and CALL sellers lose the least money—usually the strike with maximum total OI and where most contracts expire worthless. Here, the OI data shows very high concentrations at 25,500 and 25,600 levels on both sides. - Current Market Price and Implications:
The spot Nifty is at 25,709.85, trading slightly above the 25,700 mark. With the high OI and strong contest between PUT and CALL writers around 25,500–25,700, the max pain point for this expiry appears to be at 25,600. This level is likely where most options will expire worthless, and market makers may try to move prices toward this zone as expiry approaches.
What This Means for the Week
- Underlying Bias: The price is trading above the max pain, indicating bulls are in control, but there can be volatility as option writers try to pin Nifty closer to 25,600 by expiry.
- Support Levels: Strong put OI at 25,500 and 25,400 provides a cushion on any dips. Breaking below these levels might trigger unwinding and sharper falls.
- Resistance Levels: Major call OI above 25,700–25,800 could create resistance, capping further upmoves unless there’s aggressive short covering.
Strategic Takeaway
- If Spot Holds Above 25,700: Bulls remain strong, but expect some attempts to drag prices back toward the 25,600 max pain zone by expiry.
- If Spot Falls Below 25,600–25,500: Watch for sharper corrections due to heavy OI unwinding.
- Options Writers: Favor short strangles or iron condor strategies around the 25,500–25,700 band, given the range-bound OI support.
Max pain for this expiry: 25,600
Expect expiry gravitation around this zone unless there’s a major trend day or news event.
Summary Table
| Scenario | Action |
|---|---|
| Sustains above 25,700-25,800 | Hold/enter longs, trail stop, ride uptrend |
| Early reversal or exhaustion | Book partial profits, wait for retracement signal |
| Gap fill attempt (falls below 25,700) | Flip to short bias for retrace to 25,400 |
| Options (high IV) | Sell OTM calls/condors; limit short gamma risks |
Monitor intra-week news and global cues, as gap-up opens carry the risk of mean reversion if not supported by fresh buying. Stay flexible, let price action guide position sizing, and avoid over-leveraging in anticipation of reversal unless clear exhaustion signals materialise.