
Daily Nifty Analysis | Market Crash 2025 | Market Outlook | Nifty Technical Analysis | Nifty Technical Levels | Stock Market Analysis | Vie Capital
Nifty 50 Technical Analysis: Key Levels, Head & Shoulders Pattern, and Bearish Signals for September 2025
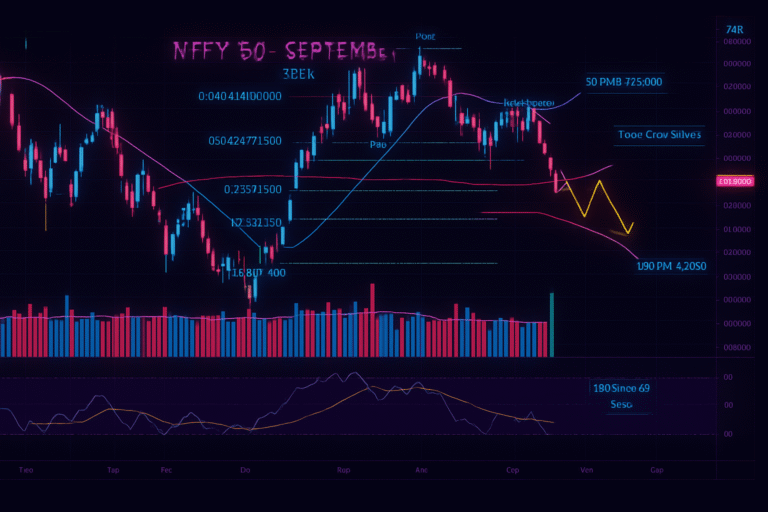
Nifty 50 Index Technical Analysis for September 1, 2025: Key Levels & Advanced Chart Insights The Nifty 50 Index delivered a technically charged session as August came to a close, setting the groundwork for a pivotal start to September. In this blog, we perform an advanced, professional breakdown of market structure, utilising moving averages, candlestick…