
Nifty 01 December 2025 : Nifty at 26,200: Is This Calm Before a Volatility Storm or the Launchpad to 26,500?
Nifty 50 is heading into the new week at a crucial technical juncture: price is retesting all‑time highs around 26,350–26,400 after a strong multi‑month rally, while volatility and positioning suggest a market that is bullish but vulnerable to short, sharp swings. This blog pulls together the recent price structure, indicators, option‑chain data, and FII–DII flows to frame what this means for the days ahead.
1. Price structure: trend firmly up, at resistance
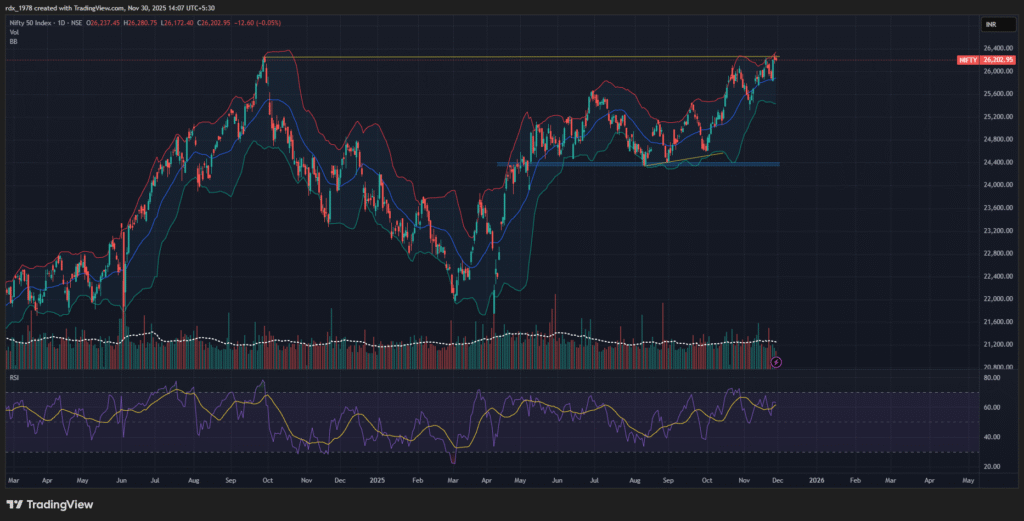
On the daily chart, Nifty 50 has been in a clear uptrend since the 24,400–24,500 base formed a few months back. The index has stair‑stepped higher through a series of higher highs and higher lows, with pullbacks consistently finding support near the 20‑day moving average (approx. 25,800–25,900) and the lower Bollinger Band.
Currently, price is:
- Trading just under the prior high zone around 26,350–26,400, effectively retesting resistance.
- Riding the upper Bollinger Band, which reflects strong momentum, not yet a confirmed reversal.
- Holding well above the last major congestion area near 24,800–25,000, which now acts as a longer‑term support shelf.
On the hourly charts, the market recently displayed a pole‑and‑flag style continuation: a sharp up‑leg, followed by a tight sideways consolidation, and then another push higher. The most recent candles show some intraday volatility but no decisive breakdown of short‑term support.
Takeaway: Directionally, the primary trend remains up. The index is in the “pressure zone” near resistance where follow‑through higher is possible, but the risk of mean‑reverting swings around 26,200–26,400 is elevated.
2. Momentum and volatility: bullish but stretched
RSI, Stochastics, MACD
Daily RSI (14) sits roughly in the 60–65 band—firmly bullish but not yet at extreme overbought. It has cooled from earlier peaks but has not flashed a strong bearish divergence; the current high retest comes with RSI slightly below its prior extreme, which usually signals “maturing but intact” momentum rather than instant reversal.
Other oscillators paint a similar picture:
- Stochastic oscillators are high (around 80–90) with a positive crossover, indicating that the market is in an overbought zone but still in buy‑the‑dip mode.
- MACD is above zero with the MACD line above the signal line—another confirmation that underlying momentum remains positive despite short‑term pauses.
Bollinger Bands and volatility
Bollinger Bands have expanded during the recent up‑leg, and price is hugging the upper band. This combination typically marks a trending move rather than a topping pattern. At the same time, India VIX is unusually low, around 11–12, near the lower half of its 52‑week range (roughly 9.4–23.2).
Low VIX plus price at resistance is a classic “complacent but extended” setup:
- Short‑dated options are cheap in implied‑volatility terms.
- The next big move in IV is asymmetrically likely to be up (a spike) rather than further down.
- Price can still drift higher or move sideways, but any surprise macro or local event can trigger a quick volatility jump with only modest price movement.
Takeaway: Momentum indicators support continued upside or consolidation rather than an immediate crash, but very low volatility makes the market vulnerable to sudden IV spikes if sentiment shifts.
3. Option‑chain and max‑pain: gravity near 26,200
Options data adds a layer of “where big money is comfortable.” Across multiple sources tracking the active Nifty 50 series:
- Max pain—the price level where option buyers would lose the most, and sellers would be most comfortable—is clustered around 26,200–26,250, almost exactly where Nifty is trading now.
- Put open interest (OI) is heaviest in the 26,000–26,100 region, establishing a strong local support band. These are the strikes where market participants have written the most puts and thus have the strongest incentive to defend.
- Call OI is concentrated between 26,300 and 26,400, forming a resistance/supply zone. As price approaches these strikes, call writers become more active in hedging or adding positions, which often caps upside in the short term.
From an options‑market perspective, the “ideal” outcome into expiry is for Nifty to oscillate near 26,200, with dips toward 26,000–26,100 being bought and rallies beyond 26,300–26,400 facing resistance. This aligns with the technical picture of a market testing highs but not yet in a clean breakout.
Scenario with a 100‑point gap:
- Gap up of ~100 points (toward 26,300+):
Price opens inside the call‑writer zone. Often this leads to early strength followed by intraday consolidation or mild selling as writers defend positions. - Gap down of ~100 points (toward 26,100):
Price moves closer to the put OI bulge; such dips generally attract support and short covering unless accompanied by very negative news.
Takeaway: Options data suggests a mean‑reverting bias around 26,200, with well‑defined support slightly below and resistance slightly above—consistent with a range‑bound but upward‑tilted environment.
4. FII–DII flows: DIIs are absorbing FII selling
Institutional flows provide context for the strength behind the move.
Cash market
Recent FII–DII data shows:
- FIIs have been net sellers in the cash market, to the tune of roughly ₹17,500 crore for November.
- DIIs, however, have been strong net buyers, accumulating about ₹77,000 crore over the same period—more than four times the FII outflow.
Daily numbers around November 28 show the same pattern: FIIs selling several thousand crores net, while DIIs buy a similar or larger amount.
F&O positioning
Participant‑wise derivatives data indicates that FIIs are:
- Net long in index futures, and
- Very active in index options, using them for both directional and hedging positions.
This creates an interesting mix:
- In cash, foreign money is cautious or booking profits.
- Domestic institutions are providing a strong bid, keeping the index elevated.
- In derivatives, FIIs still maintain long index exposure and significant options activity, reflecting hedged bullishness rather than outright pessimism.
Takeaway: The market’s resilience at highs is largely due to robust DII buying and active FII hedging. This reduces the probability of an uncontrolled collapse but does not eliminate the risk of sharp, F&O‑driven intraday moves.
5. Global cues and GIFT/SGX Nifty
Friday night’s rise in GIFT/SGX Nifty futures was driven more by global risk‑on sentiment than by domestic news:
- US indices, including the S&P 500, were trading near record highs after a late‑November rally fueled by expectations of eventual Federal Reserve rate cuts and strong performance in technology and AI‑linked stocks.
- European and Asian indices were stable to positive, reflecting a generally supportive macro backdrop.
Given this, Indian index futures followed the global tone higher. With India VIX already low and domestic DIIs providing strong support, overseas optimism easily translated into a firmer GIFT/SGX Nifty.
Takeaway: As long as global risk sentiment remains constructive, external shocks are more likely to generate brief volatility spikes than a sustained bear trend.
6. Putting it together: what it means for the coming sessions
All components—price action, indicators, options data, institutional flows, and global cues—paint a coherent picture:
- Trend: Uptrend intact; Nifty 50 is retesting all‑time highs, with no clear sign of a structural top yet.
- Momentum: Bullish but stretched. RSI and Stochastics say “strong but not parabolic”; MACD confirms positive trend.
- Volatility: India VIX is low, which supports slow grinding gains and range‑bound days but makes the system vulnerable to sudden IV spikes if sentiment changes.
- Options: Max pain and OI structure centre gravity around 26,200, with strong support at 26,000–26,100 and resistance at 26,300–26,400.
- Flows: FIIs are selling cash but are net long in index derivatives, while DIIs are absorbing supply aggressively, underpinning the market at higher levels.
In practical terms, this environment favours:
- Sideways‑to‑up movement with frequent intraday whipsaws, especially near resistance zones.
- Range‑based and non‑directional strategies that respect these support/resistance bands and account for the risk of volatility reversion from very low levels.
- Cautious use of outright directional bets: the reward for trying to chase the last leg of the rally is limited relative to the drawdown risk if an IV spike or global wobble appears.
For traders, the key is not to assume a one‑way breakout or an imminent crash, but to respect the current equilibrium: a strong trend being held up by domestic buying and global positivity, yet stretched enough that volatility, not necessarily direction, is likely to be the main surprise factor in the days ahead.