
15 September 2025 : Nifty 50 Outlook: Why a Break Above 25,300 Is Key for Next Bullish Rally
NIFTY 50 Analysis: Strong Technical Levels Amid Range-Bound Sentiment
NIFTY 50 heads into the current week with price action hovering at a pivotal resistance, according to a confluence of technical indicators, Fibonacci levels, and the latest option chain data. Here’s a systematic breakdown for trading and investing decisions.
- A breakout and rally above 25,300 on Nifty 50 would gain added significance from key macroeconomic catalysts.
- Progress on an Indo-US trade tariff deal could boost investor confidence by improving export opportunities and easing global trade tensions.
- Renewed hopes of a US Federal Reserve rate cut would increase liquidity worldwide, supporting higher valuations for Indian equities and attracting more institutional inflows.
- The combination of a technical breakout with such positive global events would likely strengthen the rally, turning it into a fundamentally driven, broad-based move.
Price Structure and Fibonacci Levels
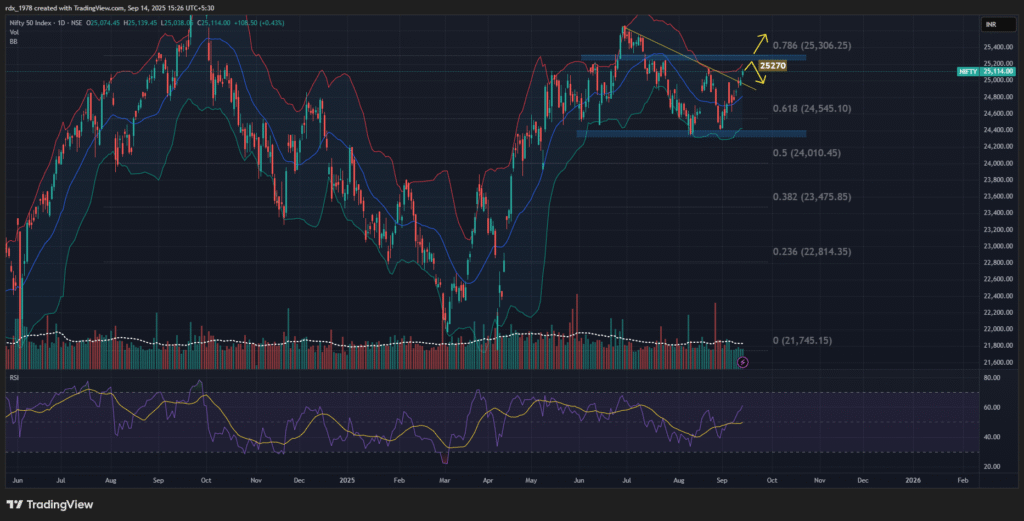
NIFTY is currently trading near 25,114, testing a cluster of resistance between 25,200–25,306 as highlighted by the 0.786 Fibonacci retracement from the April-to-June correction swing.
- These levels have historically acted as significant turning points, and the market’s reaction here will dictate the next directional move.
- If NIFTY crosses above 25,270–25,306 conclusively, bulls could target fresh highs. Support is marked at the 0.618 retracement near 24,545 and the 0.5 retracement at 24,010.
Trend and Momentum: RSI, MACD, ROC
Relative Strength Index (RSI)
- The daily RSI is rising and currently trades in the mid-60s zone, signalling building bullish momentum but not yet at overbought extremes.
- This region often aligns with the continuation of a trend. Caution should arise only if RSI moves above 70, which may indicate exhaustion.
Rate of Change (ROC)
- The ROC shows a steady uptick from the zero line, confirming that upside momentum is returning after a period of neutrality.
- ROC in positive territory tends to favour buyers but also warns of possible mean reversion if the move becomes stretched.
MACD (On Previous Chart)
- MACD lines and histogram are in a bullish phase, with the line above its signal, supporting short-term uptrend bias.
Volatility: Bollinger Bands & ATR
Bollinger Bands
- Price is hugging the upper Bollinger Band, typically a sign of bullish momentum.
- Persistent trades above the band often lead to trend acceleration, but initial touches can also precede pullbacks if sellers emerge.
Average True Range (ATR)
- ATR is at multi-month lows, indicating diminished volatility and narrow daily ranges.
- This “quiet” market phase can precede a strong move; traders should prepare for breakouts if ATR begins to climb.
Option Chain Analysis: Support, Resistance & Sentiment
Option data from the NSE shows:
- Maximum Call OI between 25,200–25,300 acts as a resistance ceiling, where institutional call sellers expect to cap rallies.
- Maximum Put OI at 24,800–24,900 creates a solid floor, where put sellers protect the downside.
- ATM Implied Volatility remains moderate, reinforcing the range-bound or orderly move expectation.
- OI changes confirm: Unwinding at lower call strikes and writing of puts at 24,900+ indicate the market’s comfort with higher bases, but caution around the marked resistance.
Volume and Price Confirmation
- Bullish volume spikes have accompanied the recent price advance, a classic confirmation that the up-move has institutional support, not just retail speculation.
- Sustained volume will be crucial for validating any breakout above 25,306.
Actionable Strategy
Range-bound bias is dominant, with a bullish tilt unless NIFTY fails to cross the resistance zone:
- Watch for decisive closes above 25,270–25,306 for a trending breakout trade.
- Short-term traders can play the range with tight stops near 24,900 support and 25,300 resistance.
- Derivatives traders may consider credit spreads (iron condor, strangles) to capitalise on expected consolidation unless ATR or breakout volume rises sharply.
Key Takeaways
- Pivot Resistance: 25,200–25,306 Major Support: 24,900 & 24,545 (Fib)
- Momentum: Bullish to Neutral, up unless RSI gets overbought
- Volatility: Low, but be ready for expansion
- Option Data: Range-bound expectation, with strong resistance and support clusters
Conclusion
NIFTY is at a technical crossroads. All key indicators—Fibonacci retracement, RSI, ROC, Bollinger Bands, volume, and option chain—point toward a pause or breakout at major resistance. Traders should remain tactical, respecting both the bullish undertone and the potential for sharp moves if the market breaks this equilibrium zone.
Persistent trend, but watch for breakouts and manage risk near crowded option strikes. The coming days should provide decisive clues.
Follow @viecapital