
Nifty 18 August 2025 – Will Bulls Regain Control or More Downside?

Nifty50 Technical Analysis – 16th August 2025
The Nifty 50 market analysis for 18 August 2025 highlights a crucial trading session where bulls and bears continue to battle for dominance. With key support and resistance levels in focus, traders are closely monitoring RSI signals and moving averages to gauge the next trend. This detailed technical analysis of Nifty will help identify whether the index can regain bullish momentum or remain under pressure from sellers.
Structure: Head & Shoulders Formation
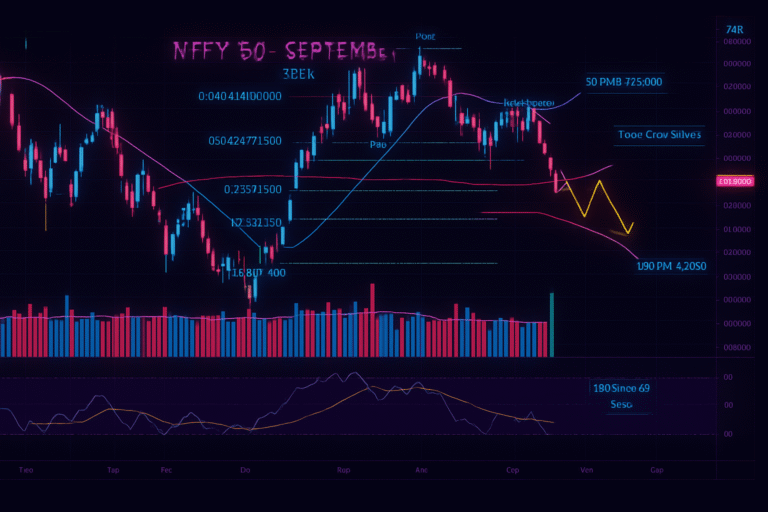
On the daily chart, a Head & Shoulders pattern has formed, typically considered a bearish setup. After breaking down, the index has seen a pullback towards the neckline zone.
- The left shoulder, head, and right shoulder are visible.
- The price has retraced back near the 24,550 – 24,800 resistance zone.
- Three candles with upper wicks indicate supply pressure at higher levels.
Key Levels to Watch
- Above 24,800 → Bulls may regain momentum and push higher.
- Resistance at 24,550 → Failure here may trigger renewed weakness.
- Support zone → 24,400 – 24,330.
- Break below 24,300 → Increases downside risk.
- Next major support → 23,800 – 23,750.
Volume & Market Strength
- A recent high-volume reversal was seen.
- However, the lack of strong follow-up buying shows that conviction among bulls is still missing.

Nifty Option Chain Analysis – 17th August 2025
The Nifty 50 option chain indicates strong Call OI buildup at 24,800, suggesting heavy resistance, while Put OI at 24,000 highlights a strong support zone. Fresh put writing around 24,400–24,500 shows bulls are defending higher levels, whereas call writing at 24,700–24,800 is capping the upside momentum. Based on the current positioning, the most probable Max Pain point is around 24,600, making it the likely expiry level. Traders should watch the range of 24,400–24,700, as a breakout above 24,800 or breakdown below 24,300 could trigger the next big move.
- Highest Call OI: 24,800 (40,413 contracts) → Strong resistance.
- Highest Put OI: 24,000 (49,683 contracts) → Strong support.
- Put writing seen at: 24,400 & 24,500 → Indicates bulls are defending these levels.
- Call writing seen at: 24,700 & 24,800 → Bears are capping the upside.
Most Probable Max Pain Point: 24,600
This is the strike where both Call and Put OI concentration balances out, meaning expiry is most likely to gravitate around 24,600.
Market View:
- Support Zone: 24,000 – 24,200
- Resistance Zone: 24,700 – 24,800
- Expiry Range Expectation: 24,400 – 24,700
- Max Pain suggests expiry closer to 24,600 unless there’s a strong breakout on either side.
RSI & Momentum
- RSI at 45 → Below the neutral 50 level, indicating that the bounce may be weak.
- The chart has already shown two strong bearish divergences earlier, which adds caution.
Conclusion
In conclusion, the Nifty 50 technical outlook for 18 August 2025 suggests that the market is at a decisive stage. If the index holds above critical support levels, buyers may push towards the next resistance. However, failure to sustain could invite further downside. Staying updated with Nifty analysis, monitoring trend patterns, and managing risk wisely will be key for traders in the upcoming sessions.
Traders should stay cautious and closely monitor the price action around these critical levels.
Follow @viecapital