Nifty 50 technical analysis blog featured image with Indian stock market and Navratri festival theme, showing bullish and bearish finance symbols
| | | | | | | | | |

08 September 2025 : Nifty 50 Technical Analysis: Head & Shoulders Pattern, RSI, MACD Signals, and Navratri Seasonal Trends

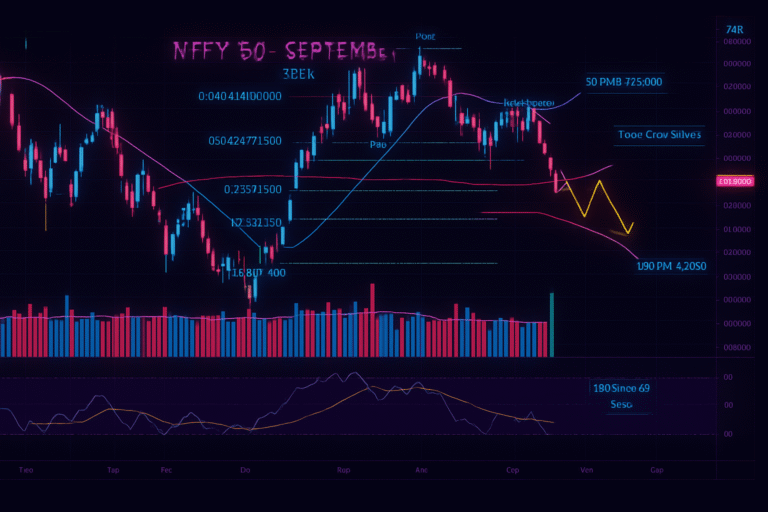
Chart Pattern Analysis The dominant structure on the chart is an incomplete Head and Shoulders pattern, with clearly labeled “Left Shoulder,” “Head,” and “Right Shoulder.” The neckline is downward-sloping, with price recently testing this boundary but failing to decisively break above it, indicating unresolved direction and a potential for a significant move upon resolution. Fibonacci retracement levels…

Abstract financial market image showing a glowing orange world map, rising candlestick chart, and upward trending lines, symbolizing global stock market growth and momentum.
| | | | | |

Nifty 50 Technical Analysis: Key Levels, Head & Shoulders Pattern, and Bearish Signals for September 2025

Nifty 50 Index Technical Analysis for September 1, 2025: Key Levels & Advanced Chart Insights The Nifty 50 Index delivered a technically charged session as August came to a close, setting the groundwork for a pivotal start to September. In this blog, we perform an advanced, professional breakdown of market structure, utilising moving averages, candlestick…

"Stock market warning signal with bearish trend and falling Nifty index chart"
| | | | | | |

Nifty Weekly Outlook (25–29 August 2025): Key Support at 24,800, Breakdown Trigger at 24,330

Nifty 50 Outlook for 25–29 August 2025 The Nifty 50 index closed near 24,870 last week, forming a Shooting Star candle on the weekly chart, signalling supply pressure at higher levels. On the daily timeframe, a Bearish Engulfing pattern emerged just below the 25,000 mark, aligning with heavy Call OI buildup, making 25,000–25,200 a strong…

India Stock Market Analysis
| | | | | | |

Nifty 20 August 2025 : Technical Analysis: Wedge Formation, Candlestick Patterns, and Key Levels to Watch

In today’s Nifty 50 technical analysis, the index is trading near a crucial resistance zone of 25,100–25,200, where multiple price patterns are converging. Traders are closely watching the market’s next move as both bullish breakout and bearish rejection scenarios are possible. Wedge Formation – Why It Matters The recent price action shows a falling wedge…

Nifty 50 market analysis chart with upward and downward stock trends, August 2025 outlook
| | | | | | | | |

Nifty 18 August 2025 – Will Bulls Regain Control or More Downside?

Nifty50 Technical Analysis – 16th August 2025 The Nifty 50 market analysis for 18 August 2025 highlights a crucial trading session where bulls and bears continue to battle for dominance. With key support and resistance levels in focus, traders are closely monitoring RSI signals and moving averages to gauge the next trend. This detailed technical…

Financial news-themed digital background design with speedometer, stock market indicators, and branding elements for Vie Capital.
| | | | | |

Nifty 11 August 2025: Expect a rebound before a fresh fall if Nifty can trade above 24400 levels with consistency !!!

Nifty Technical + Options Pulse — H&S Completed, Diamond Risk Next: Key Levels, Max-Pain and a Practical Plan The Nifty has moved from multi-month highs (~25,670) into an inclined Head & Shoulders roll-over and now appears to be forming a compressing structure (diamond / falling wedge) on the daily chart. Over the last two weeks, price action…